Net Debt Evolution

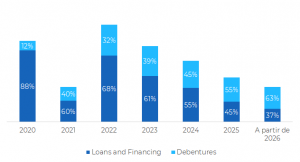
Loans, Financing and Debentures
Evolution of CAPEX¹
| In $ Thousand | 2017 | 2018 | 2019 | 09/30/2020 |
|---|---|---|---|---|
| Land | 240 | 67 | 91 | 875 |
| Buildings | 350 | – | – | – |
| Machines and equipment | 29.941 | 36.838 | 7.644 | 4.355 |
| Furniture and utensils | 9.064 | 7.459 | 5.093 | 6.090 |
| Vehicles | 1.002 | 1.100 | 962 | 64 |
| Computer equipment | 2.883 | 4.248 | 5.138 | 5.839 |
| Buidings in progress | 113.265 | 111.765 | 181.980 | 361.690 |
| Total | 156.745 | 144.176 | 200.908 | 200.742 |
¹Financial Statements – Consolidated